Extreme Weather Continues to Wreak Havoc. Can We Create a Hyperlocal Advanced Warning?

There's no great way to say it: Extreme weather has resulted in 2 million killed and $4.3 trillion in damage over the last half-century. In this staggering statistic, there is both hopeful and troubling news. Thanks to vast improvements in early warning systems, the human lives lost continue to be reduced as time goes on. However, the same can't be said for the homes, communities, and infrastructure that can't exactly run away on short notice. Property and community damage continues to rise, and this likely won't stop anytime soon. And in terms of human loss, there is a disproportionate number of lives lost in the most underdeveloped areas. It can be easy and tempting to give up hope completely, but as this is our only home and will be for a very long time, we don't get to give up. Extreme weather is causing more and more concerns with both human and property losses affecting communities globally. And if we can help, we should do it.
Given that, what can be done? While governments and other organizations are working on the problem, does that leave any opportunities for the rest of us? Maybe.
Extreme weather is by definition unpredictable, but by studying the historical trends in a given area, we can get a better idea of what to expect in a quantifiable manner. Why is this important? Because creating better preparation often takes money, and it's important to know that this type of preparation can make a real difference. It's impossible to put a specific value on human life, but just looking at property damage you could take your local community, review the trends for extreme weather (quantity and type), review the damage from those prior events, and estimate what you should expect in the next 5-10 years as the number of events increases. This can be a powerful tool in asking your community for support, especially if you can find reliable investments that can help to prevent property and community damage, or that can reduce the risk of human loss.
While calculating the past losses from extreme weather varies from community to community, being able to determine past extreme weather trends can be surprisingly simple. With a little coding, we can even take in the data we have about quantifiable losses and merge it with historical data trends.
Tutorial: Pulling Historical Extreme Weather Data and Merging with Weather-Related Losses
For this tutorial, we will take a realistic example of how you could examine a particular type of extreme weather event and match it with the negative effects it has on your community. To keep it simple, we will use historical weather data via API. We will cross-reference the number and trend of winter storms for a given location, then cross-reference it with the number of delivery delays for prescription medicines, indicating stress to the overall health and safety of the community.
Introduction
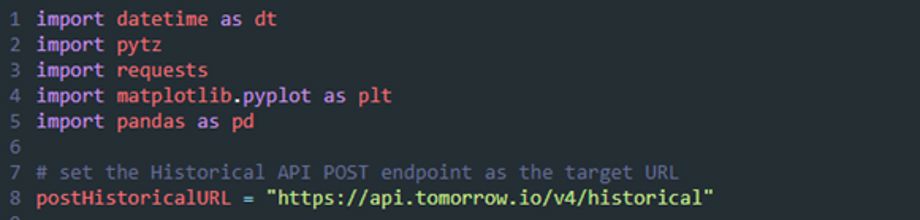
For this data pull, we will use Python to connect the weather API and the prescription medicine delivery information. Using the historical endpoints since 2015, we can get an idea of the delays as a direct cause of winter storms.
API Key
Since we are using the Tomorrow.io data, you will need to sign up for an API key to access the data.
![]()
Select Location
For this step, you can select the coordinates for any location. If searching for a particular community, select the center of the town/city.
![]()
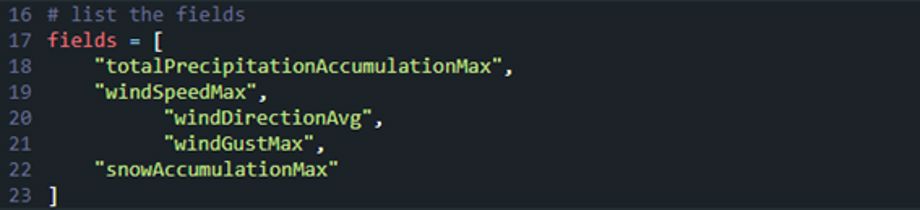
Fields of Interest
Select the different fields you would like to pull weather data for. Since we are looking for winter storms, we can pull several wind fields (max speed, direction, and gusts), and snow accumulation.
Unit System
In this step, select either imperial or metric for your units of measure.
![]()
Timesteps
Depending on the window of historical time you are searching, select an appropriate time step that can provide a solid trendline. You can select 1h or 1d (hour and day) timesteps.
![]()
Time Frame
Select the period of time you want to cover. This could be a few days or could extend all the way back to 2015 (use the date/time format shown below).

Time Zone
Use the standard IANA Time Zone Database format to select the time zone you want to display all the elements.
![]()
Request the Timelines
This step allows you to compile all the query string parameters (be sure to add the units of measure so the data remains easily understood).
![]()
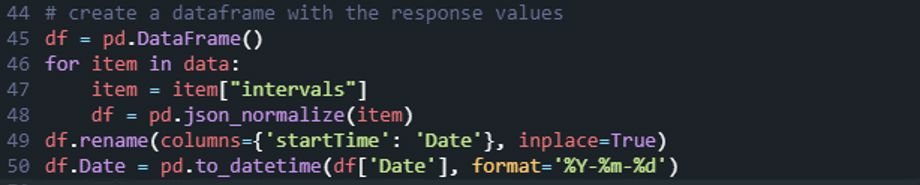
Dataframe
This step uses Python Pandas to set up the data so we can enter it into a dataframe object.
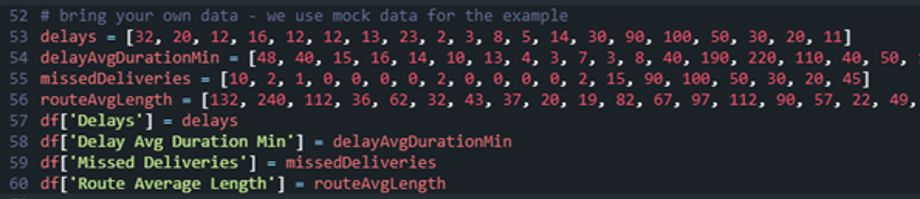
Bring Your Own Data
This step is highly dependent on what you'd like to do. In this case, we pull in the delivery delays from the prescription medicine over the course of time we are looking at.
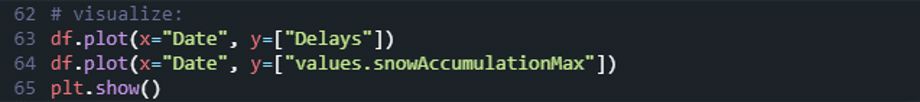
Visualize
Finally, you can build a plot that can quickly identify correlations between medicine delays and concurrent winter storm activity.
Final Thoughts
By using data to gain valuable insights and understand the cost and effects of growing extreme weather, we can help to show others just how big of an issue it is and work together to find the innovations and resources to better protect our communities.
(Devdiscourse's journalists were not involved in the production of this article. The facts and opinions appearing in the article do not reflect the views of Devdiscourse and Devdiscourse does not claim any responsibility for the same.)


